One view across every repo's CI

One view across every repo's CI
The problem
This portfolio is not one repository. Listener Analytics ETL, Devfolio-Next, browser extensions, and other projects each run their own GitHub Actions workflows. Checking whether CI was healthy meant opening every repo separately.
Why it matters
When a pipeline breaks silently, nothing downstream gets refreshed — the same failure mode as Databricks or MDM jobs stalling at work. You need one place to see failures before they become surprises.
Approach
Cloudflare Pages Functions proxy the GitHub REST API against an explicit GHA_REPOS allowlist — the PAT never reaches the browser, and no repo-discovery endpoints are called. Responses are cached at the edge (~30 minutes via Workers Cache API) so repeated dashboard loads stay inside GitHub rate limits; ?refresh=1 bypasses cache when you need a live read.
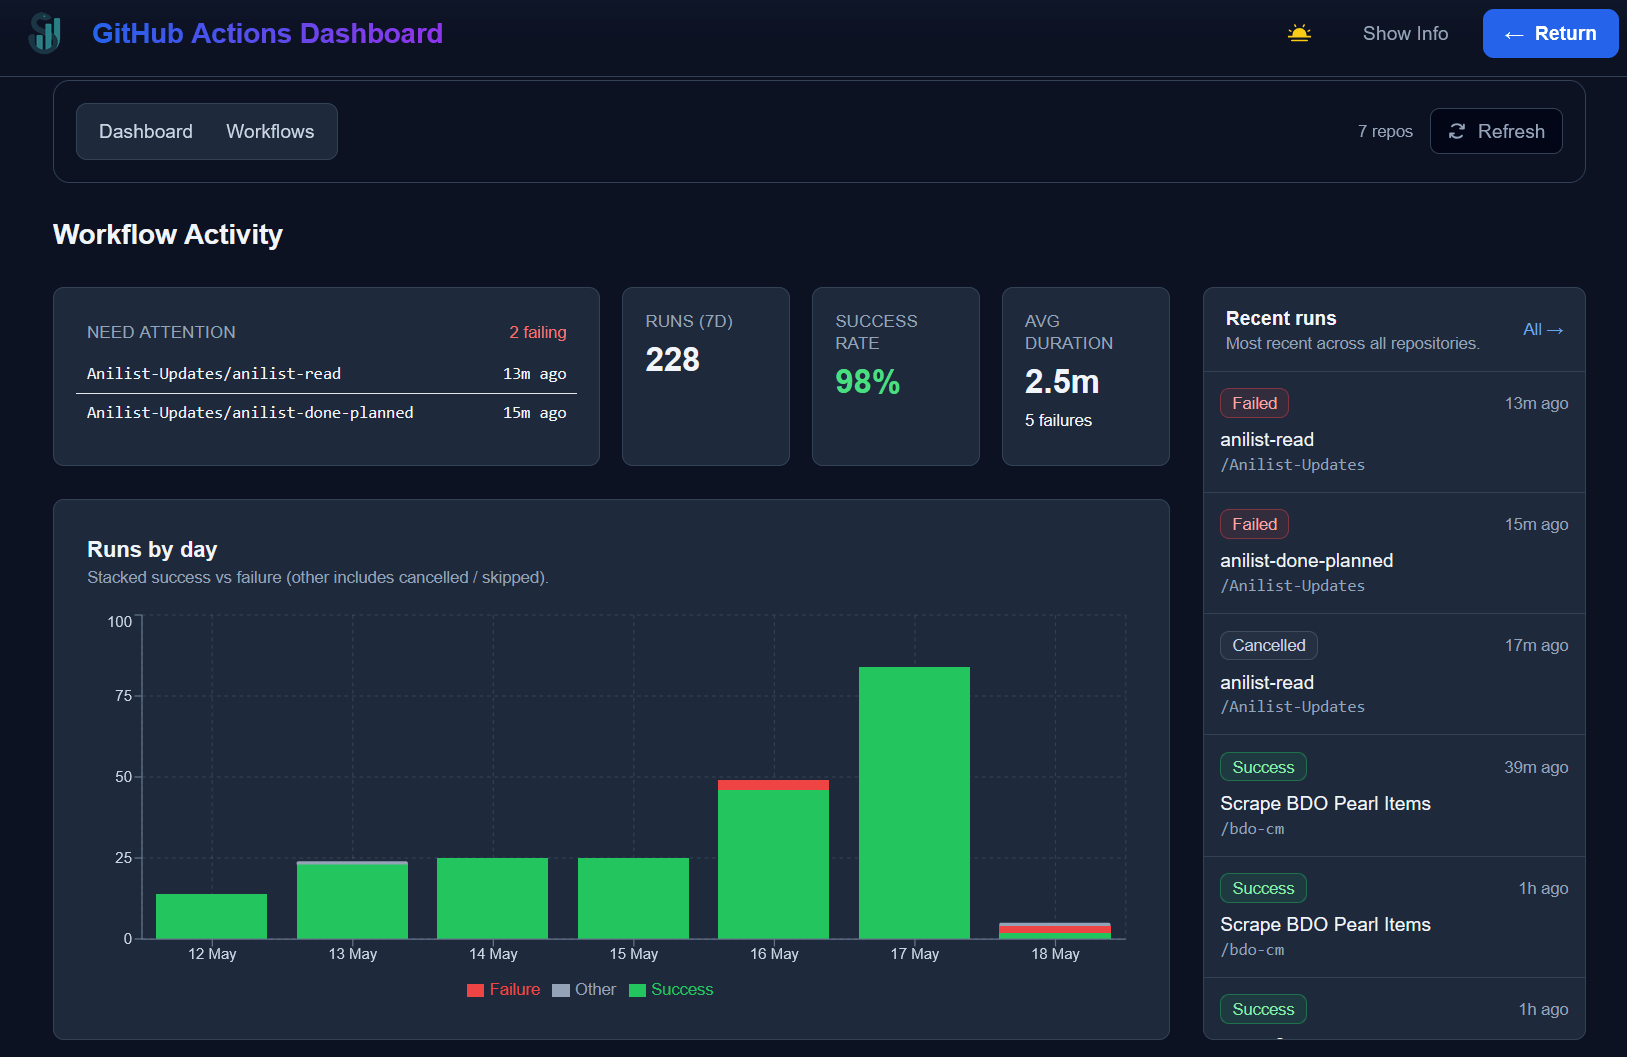
A native React dashboard aggregates KPIs, a 7-day run trend, recent activity, and a Need attention panel for workflows whose latest run failed. A separate /api/gha/workflows/latest endpoint exposes the same data in a slim, poll-friendly shape for browser extensions listed in ALLOWED_ORIGINS.
Outcome
One consolidated view replaces repo-hopping across Listener Analytics ETL, Devfolio-Next, extensions, and other portfolio repos. Failures surface in Need attention before stale data becomes a surprise downstream. Open the live dashboard to drill into per-workflow success rates on the Workflows page.
Technical details
GHA_REPOS comma-separated allowlist is the only scope — no account-wide repo enumeration.
PAT stored server-side; /api/gha/* routes gated by origin check (same pattern as R2 signed URLs).
Cache key = route ID + SHA-256 hash of sorted repo list; default TTL 1800s.
Endpoints: /dashboard/summary, /workflows, /workflows/latest, /meta.
See the live dashboard or report this write-up describes.
Open live dashboard